Heating Costs 2024-2025
This will be an annual series of posts trying to estimate the costs of heating my house over the years. I’ve been collecting data since 2016 in an excel file but I will try to explain a bit the numbers and the calculations to my future self.
Originally, this spreadsheet was intended to track the revenue of the solar panels. Later on, heatpumps were added to the equation to reduce heating bills, which peaked over 1100€ per year just in gas. Please remember that the values used here are my own and might not fit your house or your use. Mind the gap.
The numbers
| Heating Source | kWh/day | Cost/Unit | kWh/unit* | COP** | Heat price/kWh (€) | Cost per day (€) | Cost per Month (€) |
| Wood Stove | 75 | 0,15€/kg | 4 | 0,75 | 0,05 | 3,75 | 112,50 |
| Gas Furnace | 75 | 0,0511€/kWh | 1 | 0,9 | 0,06 | 4,26 | 127,75 |
| Heatpump | 75 | 0,124€/kWh | 1 | 3,5 | 0,04 | 2,66 | 79,71 |
| Diesel Furnace | 75 | 0,97€/litre | 10 | 0,9 | 0,11 | 8,08 | 242,50 |
| Butane (catalytic) | 75 | 16€/cylinder | 160 | 1 | 0,10 | 7,50 | 225,00 |
* kWh/unit represents the energy available in a single purchase unit (e.g., 160-170 kWh per butane cylinder).
** COP = Coefficient of Performance measures the efficiency of heating sources. In heatpumps A COP of 3.5 means 1 kWh of electricity produces 3.5 kWh of heat. In a wood stove, a COP of 0.9 means that the efficiency of the stove is 90%.
Prices (€) are based on official tariffs. In Spain we call this PVPC for electricity and TUR for piped gas, both similar to spot price in other countries.
Other assumptions:
- Indoor temperature is set to 21.5º from 7AM to 10PM and 18.5º from 10PM to 7AM.
As it can be seen, with the prices of the wood (or pellet) going back to normal after the pandemics and the price of the electricity going up due to the winter and lack of solar input, the monthly price is similar between heatpumps (1st) and wood stove (2nd). Of course the final price of electricity will be lower in my use case because of the solar panels and the 5kWh battery that help me dodge the worst hours in the spot market.
For the interest of the accuracy, last winter the real usage of heating was very close to the estimations. Average heatpump electricity usage was roughly 650kWh per month between October and March. Taking into account the COP of the heatpump, the average heating needs were 75.8kWh per day.
Is it worth it?
But let’s go back to the original intention of the spreadsheet.
Are the solar panels paying for themselves? In my case, yes, they are.
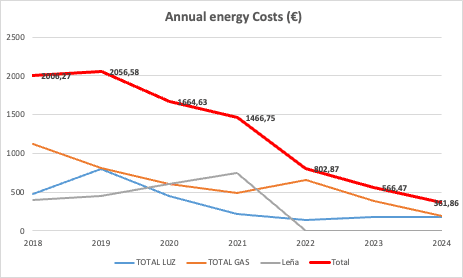
From the graphs attached, sorry the data is not complete for 2024 as the time of writting this, we can clearly see that the annual energy costs peaked in 2019 at 2056€. Electricity bill peaked the same year in 798€ because of the electric car bought in Aug’19.
Solar panels were installed in the summer of 2020 and some more were added late summer of 2021 at the same time that a 5kWh battery was installed. Total cost of the system was 9.000€ for a total of 8.5kWp of solar panels and a 5kWh battery.
From there, we have learned a lot on how to better use the energy (that probably will be detailed in another post) and the energy bill has been reduced to 566€ in 2023. That is a lot taking into account that energy prices have been raising over the years.
This year, the estimation sets the electricity bill just over 200€, in 2023, annual electricity bill was 186€.
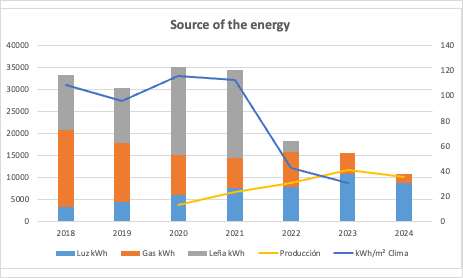
The second graph shows the source of the energy in kWh. Here we can see that reducing to zero the wood consumption has been the right decision to make but also, moving almost 100% to heatpumps has been a major change. Heatpumps were already installed in the house when we bought it back in 2016 so the cost cannot be computed.
Please note that we run hot water from the gas furnace and from time to time we use it also for extra heating, specially when outside temperatures are below 5ºC. It is our backup heating system. Also, but less often we fire the wood stove because it’s charm and cozy (and we have some free wood).
CO2 Emissions
Of course, we can greenwash a bit the numbers if we run a CO2 emissions simulation make some numbers on how the CO2 emissions look like:
Emission factors per energy source (approximate averages):
Wood stove: 0.015 kg CO₂/kWh (carbon-neutral assumption with some emissions).
Gas furnace: 0.202 kg CO₂/kWh.
Heat pump: 0.131 kg CO₂/kWh.
Diesel furnace: 0.268 kg CO₂/kWh.
Butane: 0.233 kg CO₂/kWh.
Ballpark Winter season CO₂ emissions for each heating source:
- Wood Stove: 222 kg CO₂/season
- Gas Furnace: 3,030 kg CO₂/season
- Heat Pump: 540 kg CO₂/season
- Diesel Furnace: 4,020 kg CO₂/season
- Butane: 3,145 kg CO₂/season
Solar production (on average) for the period from October to March is 3,440kWh of which 70% is used in heating, so around 2400kWh of the 4100kWh needed for heating are CO2 free. Let’s redo the numbers 😀
- Wood Stove: 222 kg CO₂/season
- Gas Furnace: 3,030 kg CO₂/season
- Heat Pump: 540 kg CO₂/year 223 kg CO₂/season
- Diesel Furnace: 4,020 kg CO₂/season
- Butane: 3,145 kg CO₂/season
Next steps
As we have seen, there is still room for improvement, and it will be done.
First step will be adding extra insulation to the house. It’s not that bad but it can be better. Adding rockwool bats to the ceiling of the main floor will give us a better insulation resulting in more confort and less energy use.
Second step will be adding more solar panels. Production is more than enough in the summer months but is not nearly enough in the winter months. That is always a fact. Adding 3.5kWp of new panels to the house will close the gap in the winter months. In the summer… surplus will be HUGE.
Of course, that will make good posts here. 🙂