Solar Panels Revenue: A Journey to Energy Independence
Continuing the series of analyses from my Excel spreadsheets, this post delves into the cost and revenue of my solar panels.
Starting the Solar Journey
In 2016, I was convinced that solar energy was essential wherever feasible. Luckily, my house offered enough space for a decent system. However, Spain’s infamous solar tax, which stifled installations—even for home use—was a significant hurdle. This tax was abolished in late 2018, opening the door for solar to flourish in Spain.
Sizing the system
My goal was simple: install as many panels as the roof could accommodate with professional installation. However, finding a reliable installer was anything but simple. After contacting 10-12 companies, I encountered a range of approaches—some proposed drilling the slates, others suggested gluing supports, and a few focused on battery setups. None were ideal, so I decided to research a solution myself.
Finding the right Hardware
Eventually, I found a Belgian company specializing in slate hooks, which provided a reference to a supplier in Europe. I purchased the hooks from Rebacas, who generously offered a discount. Installing them, however, required expertise.
I reached out to a slate specialist from León, 350 km away, who happened to have nearby work. They kindly installed the hooks with my assistance—guided by manufacturer videos. Two hours later, the hooks were ready for the panels.


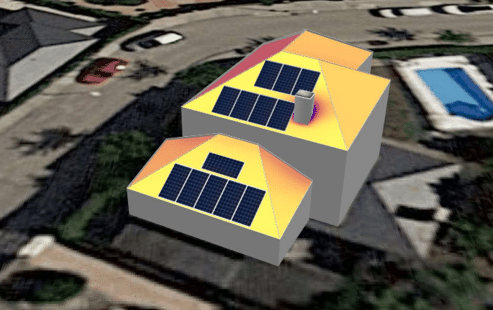
Installing the Panels
My initial setup included 13 panels on the southwest roof, totaling 4.75 kWp peak power. After evaluating various installers, I chose Yance Energías Renovables, who provided a quote of €4,287 + taxes, including a 4 kW Huawei inverter, wiring, and legal documentation.
On June 15, 2020, the installation was completed, and I began producing my energy the very next day.
More Panels
A year later, I wanted more. I added 7 more panels to the southeast roof, a new 5 kW Turbo Energy inverter, and a 5 kWh battery, totaling €3,000 + taxes. My complete system now stands at 8.5 kWp, with a total investment of €9,000.
Is it worth it?
Absolutely. Here’s why:
Electricity Usage Over Time
From 2018 to 2024, my electricity consumption has increased, primarily due to switching heating from gas and wood to heat pumps. The table below illustrates this trend:
| kWh Total | 2018 | 2019 | 2020 | 2021 | 2022 | 2023 | 2024 |
| Jan | 258 | 275 | 474 | 550* | 545 | 1113 | 1155 |
| Feb | 293 | 295 | 461 | 570* | 577 | 1020 | 1061 |
| Mar | 246 | 262 | 343 | 550* | 550 | 920 | 882 |
| Apr | 253 | 283 | 314 | 700 | 722 | 643 | 739 |
| May | 277 | 241 | 388 | 700 | 721 | 813 | 691 |
| Jun | 274 | 301 | 600* | 850 | 848 | 850 | 847 |
| Jul | 308 | 349 | 600* | 700 | 690 | 962 | 950 |
| Aug | 275 | 440 | 600* | 799 | 785 | 956 | 952 |
| Sep | 194 | 452 | 600* | 630 | 631 | 635 | 723 |
| Oct | 313 | 594 | 500* | 580 | 526 | 648 | 738 |
| Nov | 253 | 557 | 520* | 519 | 630 | 987 | 886 |
| Dec | 313 | 447 | 550* | 554 | 634 | 1135 | |
| Year Total | 3257 | 4496 | 5950 | 7702 | 7859 | 10682 | 9624 |
* Please note that data from Jun2020 to Mar2021 is estimated data. I have lost that part of the series and had to use the average.
Energy Costs
Over the years, the electricity price has inreased significantly, peaking in 2022 with the Ukraine war in nearly 0,3€ per kWh.
| Average Spot Price* | 2018 | 2019 | 2020 | 2021 | 2022 | 2023 | 2024 |
| 0,124558 | 0,14195 | 0,1214 | 0,21767 | 0,28729 | 0,1468 | 0,12394 |
* source: ESIOS
Now, we can estimate the annual bill just for the energy
| 2018 | 2019 | 2020 | 2021 | 2022 | 2023 | 2024 | |
| Estimated Energy annual bill | 405,69 | 638,21 | 722,33 | 1676,49 | 2257,81 | 1568,12 | 1192,80 |
Please note that taxes and supplements represent almost another 50% extra to the bill.
Lets take a look at the reality of the bill, put special attention in the years 2018 and 2019, before the solar panels to spot the difference between the estimations from usage and the real bill.
Energy Savings
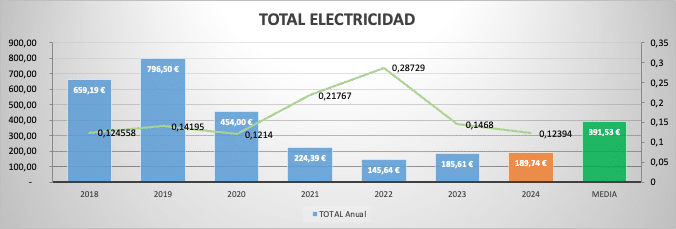
In the attached graph we can spot the avg price for the electricity and the total bill for the year. Peak bill was in 2019 were an electric car was added to the equation by the end of the summer. Almost 800€ of electricity.
But then, it came the pandemics and, of course, the use of electricity in the firsts months of 2020 was lower than expected. Not charging the car was a big deal.
Before solar, my estimated electricity bill for 2022 was 2257€. After installing solar panels, my annual bill dropped significantly, with 2022 being the lowest at 145€.
Here’s the comparison between estimated and actual bills:
| 2018 | 2019 | 2020 | 2021 | 2022 | 2023 | 2024 | |
| Estimated Energy annual bill | 405,69 | 638,21 | 722,33 | 1676,49 | 2257,81 | 1568,12 | 1192,80 |
| Real Bill | 659,19 | 796,5 | 454 | 224,39 | 145,64 | 185,61 | 173,93 |
| Savings | 268,33 | 1452,10 | 2112,17 | 1382,51 | 1018,87 |
The sum of the savings in November’24 is 6233€
Heating Cost Reductions
But the cost was 9000€! It will take 7+ years to pay for it self! Well, as we could see in the heating estimations post, this electricity bill is paying for almost all the heating of the house that, before, was heated using gas and wood. Let’s look at the heating bills.
Please note that Piped gas bills are bimensual and the data for 2024 is not yet complete.
This next graph represents the kWh usage from the Gas furnace all over the year for heating and hot water.
| 2017 | 2018 | 2019 | 2020 | 2021 | 2022 | 2023 | 2024 | ||
| FEB-ABR | 2475 | 5159,7 | 2340 | 3068 | 1445 | 1351 | 1484 | 1029 | |
| ABR-JUN | 850 | 854,1 | 257,4 | 1076 | 836 | 566 | 410 | 422 | |
| JUN-AGO | 573,3 | 713,7 | 397,8 | 483 | 670 | 398 | 358 | 266 | |
| AGO-OCT | 760,5 | 140,4 | 596,7 | 409 | 387 | 452 | 116 | 296 | |
| OCT-DIC | 5522,4 | 6154,2 | 4949,1 | 1468 | 1398 | 2467 | 1147 | ||
| DIC-FEB | 8026,2 | 4598,1 | 4882 | 2669 | 1927 | 2601 | 1260 | ||
| TOTAL kWh | 18207,4 | 17620,2 | 13423 | 9173 | 6663 | 7835 | 4775 | 2013 |
And total bill in €
| 2016 | 2017 | 2018 | 2019 | 2020 | 2021 | 2022 | 2023 | 2024 | |
| FEB-ABR | 308,54 | 203,17 | 296,47 | 96,05 | 189,01 | 94,16 | 106,29 | 118,67 | 79,53 |
| ABR-JUN | 61,04 | 56 | 60,16 | 55,53 | 78,89 | 62,35 | 59,73 | 39,87 | 42,88 |
| JUN-AGO | 47,82 | 52,45 | 59,42 | 44,07 | 48,96 | 59,16 | 50,31 | 39,34 | 33,15 |
| AGO-OCT | 48,44 | 57 | 22,55 | 49,66 | 39,65 | 42,43 | 50,07 | 22,62 | 32,37 |
| OCT-DIC | 258,7 | 303,18 | 390,55 | 277,16 | 90,58 | 100,01 | 183,86 | 75,96 | |
| DIC-FEB | 362,78 | 438,08 | 297,93 | 292,61 | 159,54 | 134,25 | 206,97 | 84,40 | |
| TOTAL | 1087,32 | 1109,88 | 1127,08 | 815,08 | 606,63 | 492,36 | 657,23 | 380,86 | 187,93 |
Average annual gas bill was 1034€ before the panels and decreased up to 380€ in 2023. The average gas bill from 2020 to 2023 is 534€. Over 5 years (2020 to 2024), the average saving in gas sums 2,670€. But there is more. Remember that we used to burn wood and we had to pay for it.
I don’t have all the bills for the wood, only the ones ranging from 2019 to 2021, that was the last year that we paid for wood. The average bill is 600€ for 4 metric tons of wood. Wood prices range from 0.1€ to 0.2€ depending on the year and the demand. It’s a bit of a crazy market full of jugglers.
Let’s add 3 years of no wood to the numbers. That adds another 1,800€ in savings.
So final numbers as for November 2024 look like this
- Electricity Savings: 6,233€
- Gas savings: 2,670€
- Wood Savings: 1,800€
In just five years, my solar panels have saved me 11,703€, exceeding their initial cost of 9,000€. That’s an annual ROI of approximately 6%, with additional non-monetary benefits like reduced environmental impact and energy independence.